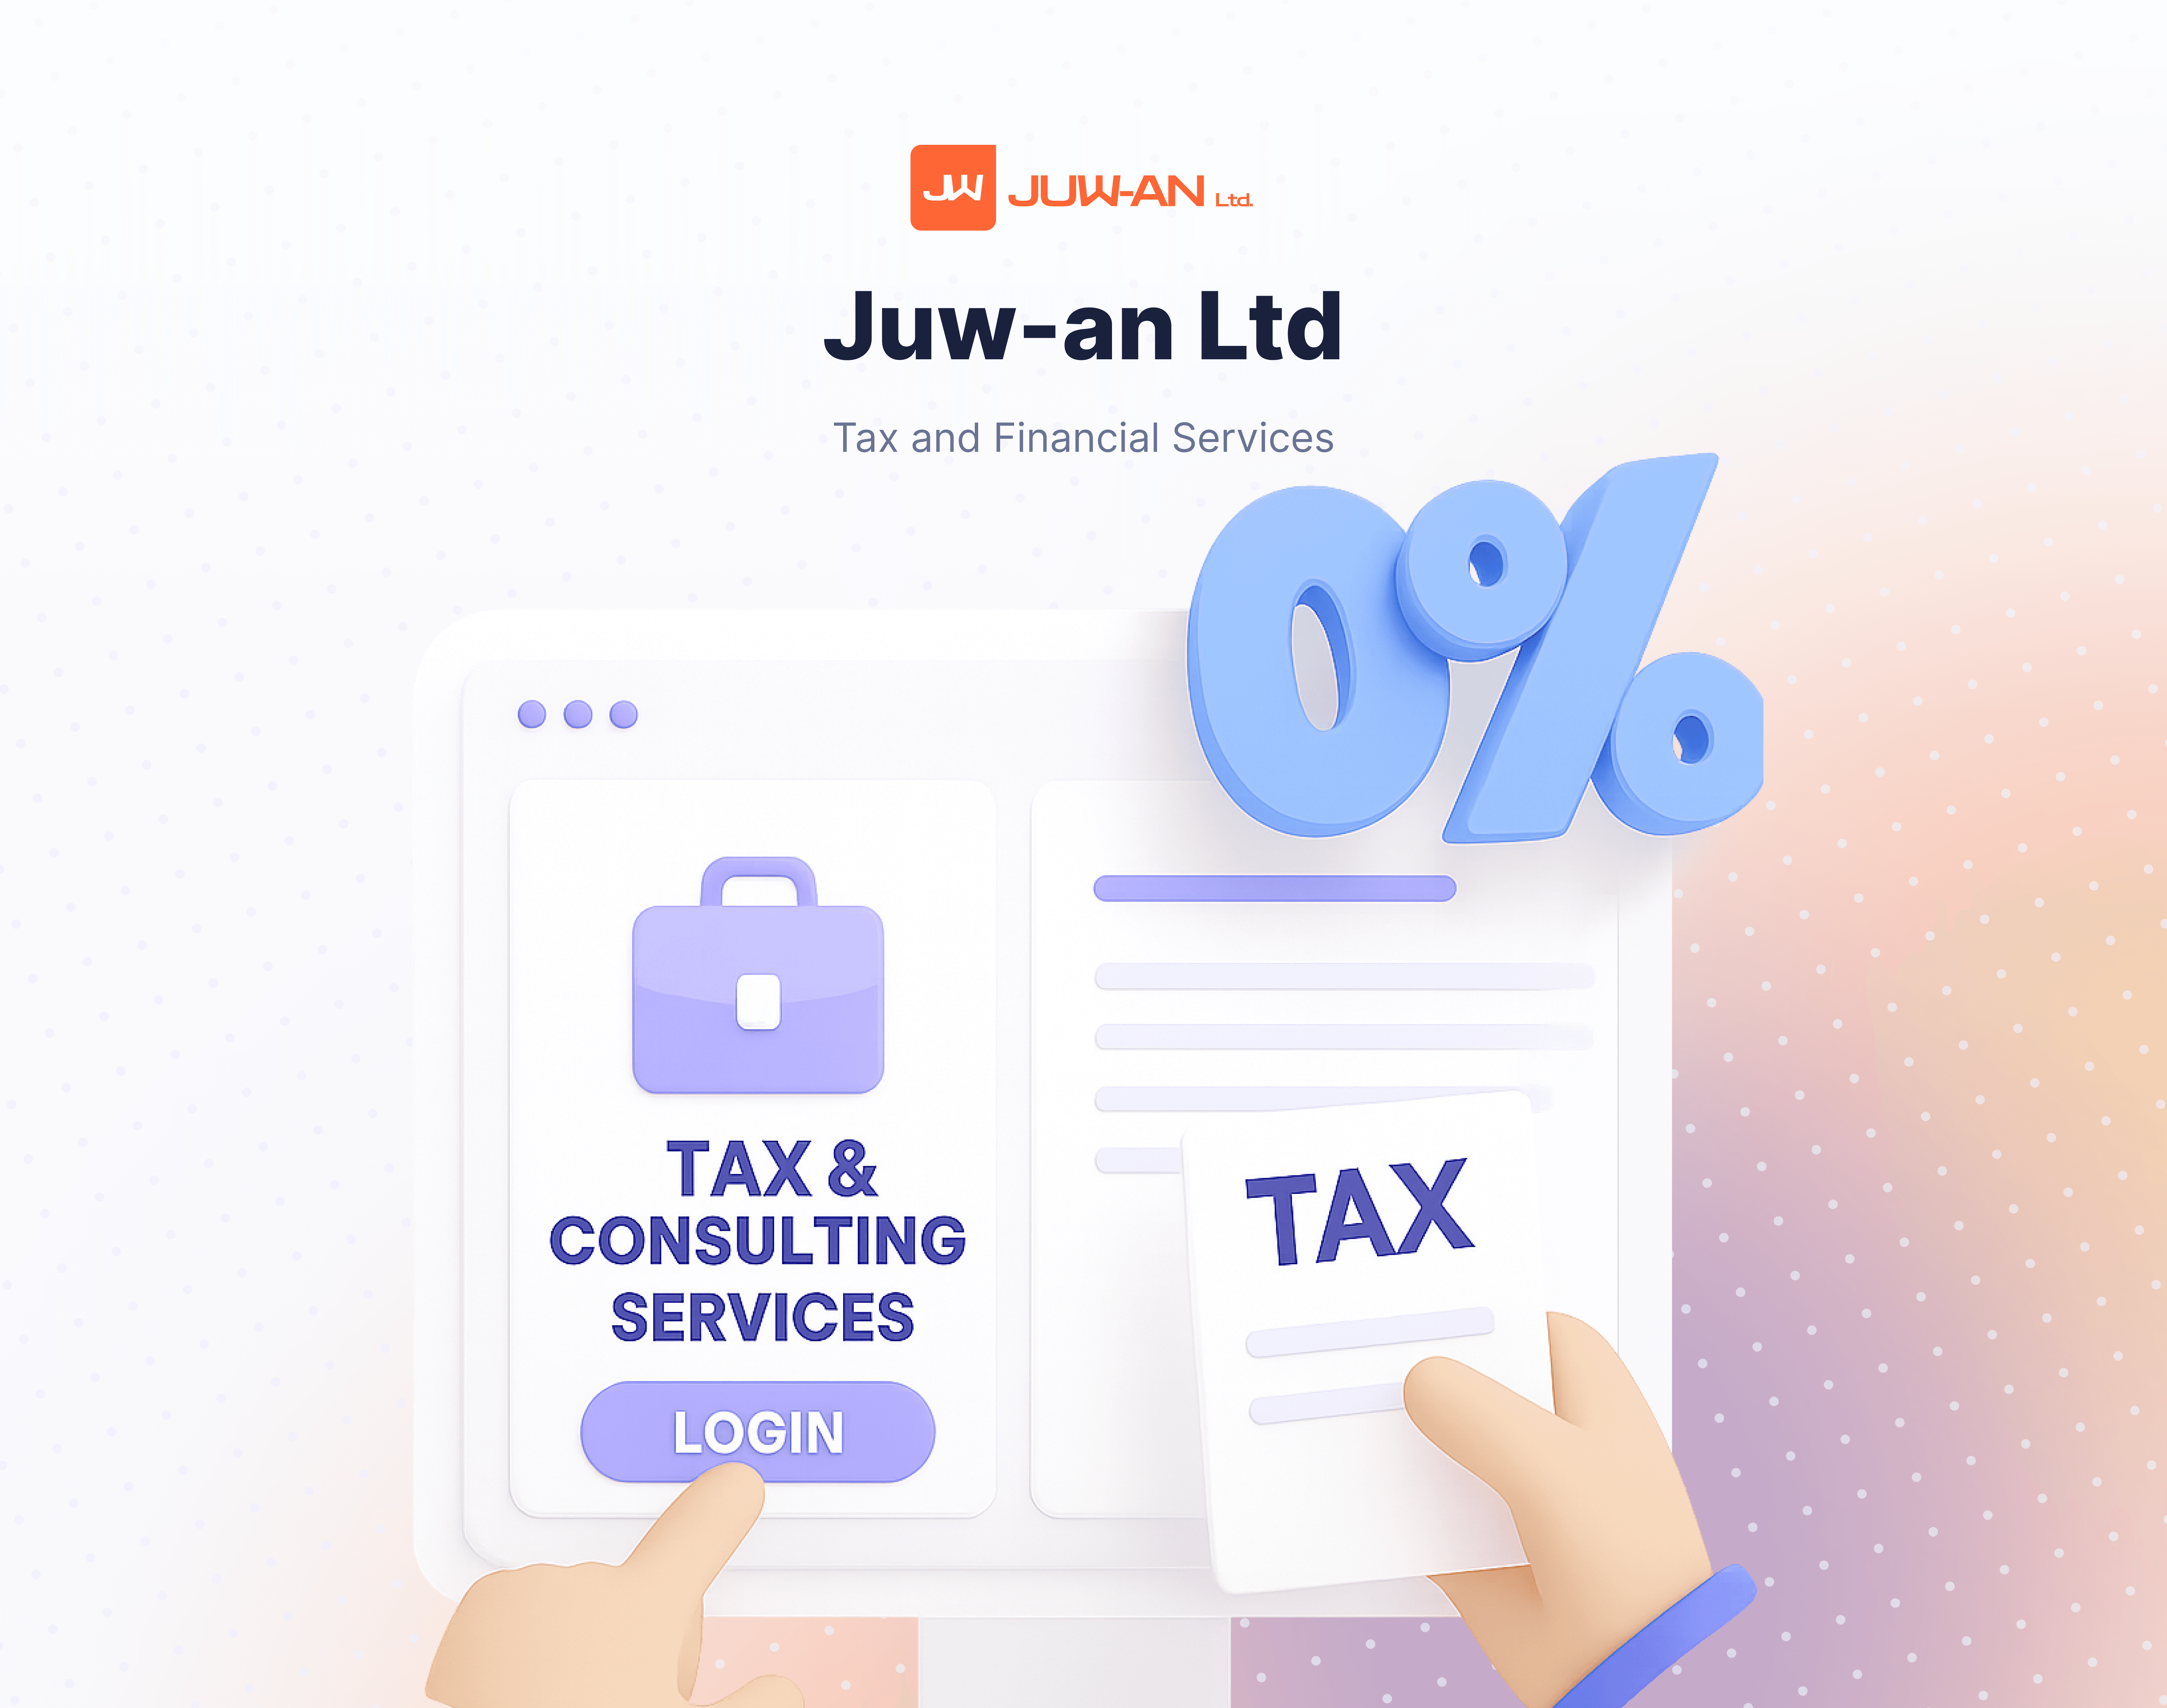
juw-an ltd
Tax and Financial Services
The Challenge
JU-WAN LTD had been operating as a traditional tax and finance consultancy for over a decade, relying entirely on manual processes. Clients would visit the office, drop off physical documents, and wait for phone calls about their application status. This approach created several problems:
Client Frustration: Customers constantly called asking "What's the status of my application?"
Operational Inefficiency: Staff spent 40% of their time answering status inquiries instead of working on actual tax preparation
Document Chaos: Physical files were scattered across multiple filing cabinets, leading to lost documents and delays
Limited Growth: The manual process couldn't scale beyond their current client base of 200 active customers
Competitive Disadvantage: Newer firms were attracting clients with digital-first approaches
The company's owner realized that without modernization, JU-WAN would lose market share to more tech-savvy competitors.
Research & Discovery
User Research
We conducted interviews with 25 existing clients and 15 potential customers to understand their pain points:
Existing Clients:
78% wanted to track their application progress online
65% preferred uploading documents digitally
89% were frustrated by the lack of communication during the process
52% had considered switching to competitors for better service
Potential Clients:
92% expected a professional website before considering the service
71% wouldn't use a service without online capabilities
84% wanted transparent pricing information upfront
Competitive Analysis
We analyzed 12 competing tax services in the UK market:
83% offered client portals
67% provided real-time status tracking
58% had mobile-responsive experiences
Only 25% offered comprehensive document management
Technical Audit
The existing infrastructure assessment revealed:
No digital systems beyond basic email
All client data stored in physical files
No backup or disaster recovery procedures
Staff using personal devices for work communication
Solution Strategy
Phase 1: Foundation
Build a professional landing page to establish credibility
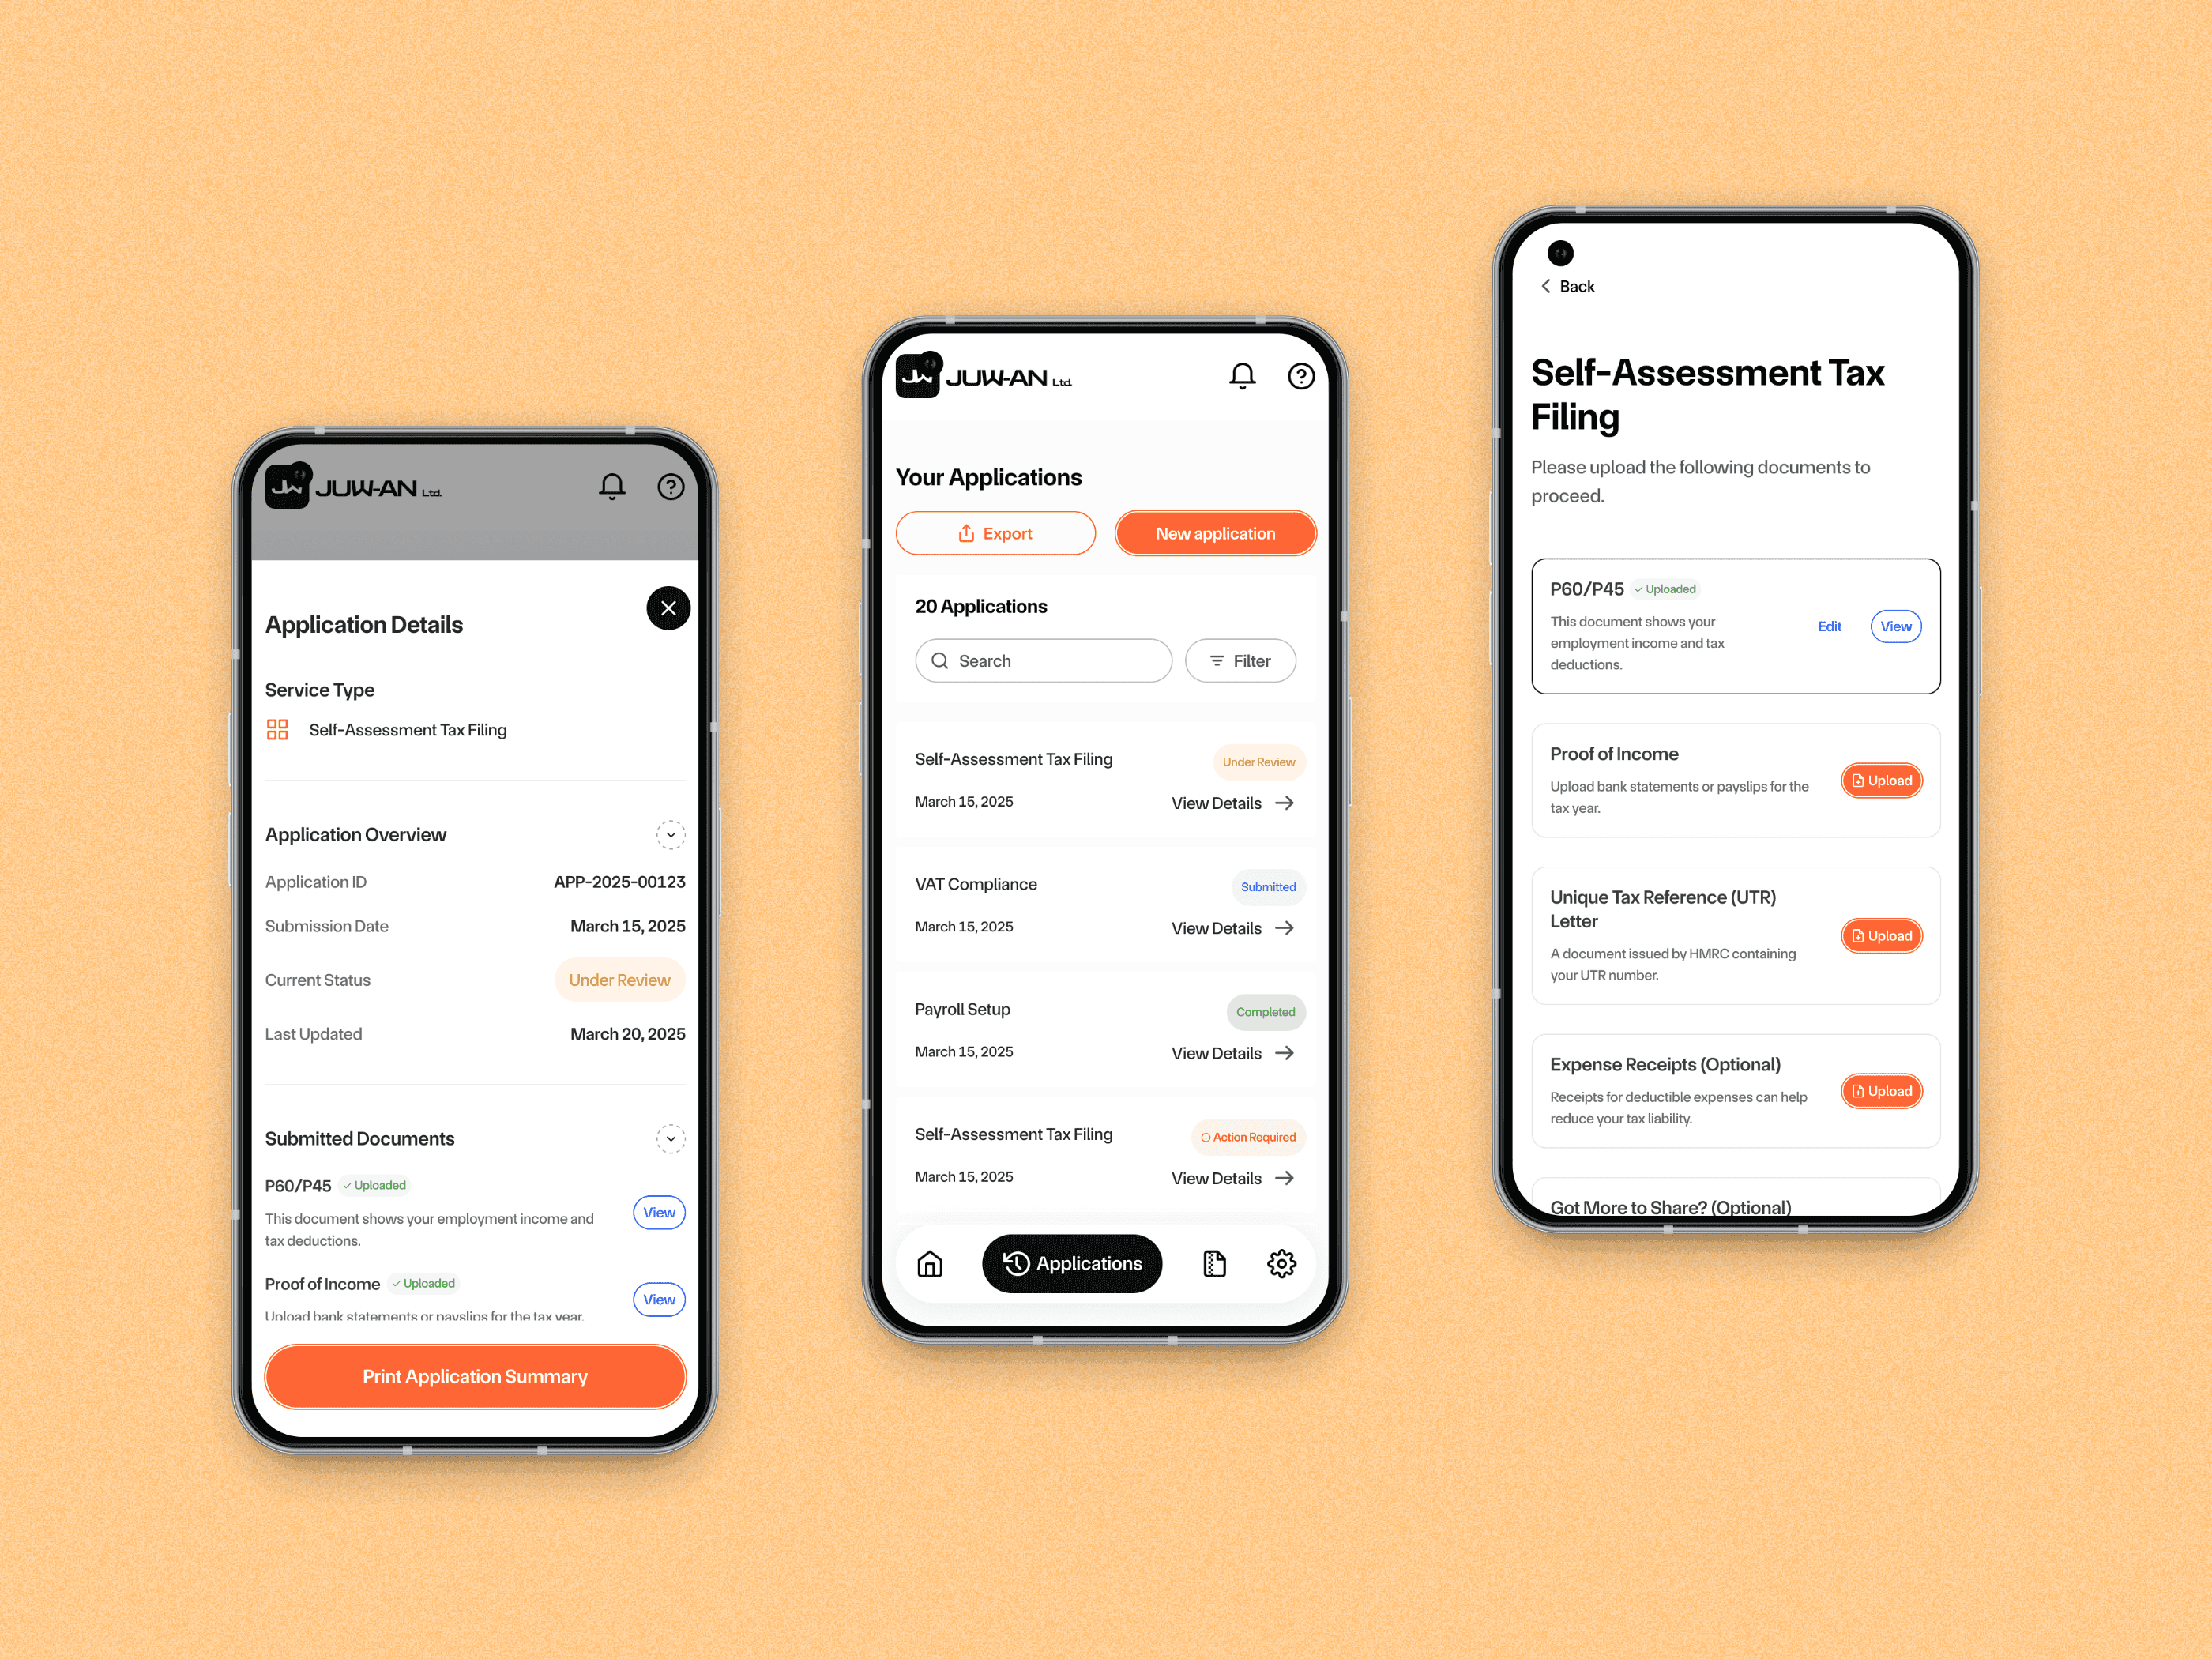
Create a secure client portal for existing customers
Implement basic document upload functionality
Phase 2: Enhancement
Add real-time progress tracking
Integrate email notifications
Develop mobile-responsive design
Create admin dashboard for staff
Phase 3: Optimization
Advanced document management with version control
Automated workflow triggers
Client communication center
Performance analytics and reporting
My Design Process
As the sole UI designer on this project, I was responsible for creating the entire visual experience across three distinct platforms: the public-facing landing page, the client web application, and the admin dashboard. Each platform required different design approaches while maintaining a cohesive brand experience.
Design Brief & Requirements
Project Requirements: The client needed a complete digital transformation from their manual operations. I was provided with business requirements and user pain points gathered by the project team:
Key User Pain Points:
Clients felt "left in the dark" during the tax preparation process
The uncertainty created more stress than the actual tax complexity
Visual progress indicators were crucial for peace of mind
Mobile access was essential for busy professionals
Trust signals were paramount when dealing with sensitive financial data
Design Challenge: Create three distinct but cohesive digital experiences: a professional landing page to attract new clients, an intuitive client portal for service management, and an efficient admin dashboard for staff workflow optimization.
Information Architecture & User Flows
Site Mapping Process: I created comprehensive site maps for all three platforms, mapping every possible user journey:
Landing Page: 1 key page with 15 conversion touchpoints
Client Portal: 23 unique screens with 47 modal interactions
Admin Dashboard: 31 screens covering the complete workflow management
User Journey Mapping: I mapped out three critical user journeys:
New Client Onboarding: From landing page discovery to first document upload (12 touchpoints)
Service Progress Tracking: From submission to completion (8 key interaction points)
Admin Workflow Management: From client intake to service delivery (15 workflow stages)
Visual Design Strategy
Brand Identity & Visual Design
Logo Design: I designed a logo for JU-WAN LTD. The new logo features:
Clean, modern typography that conveys professionalism
Subtle geometric elements that suggest precision and structure
Balanced proportions that work across digital and print applications
Scalable design that maintains clarity at all sizes
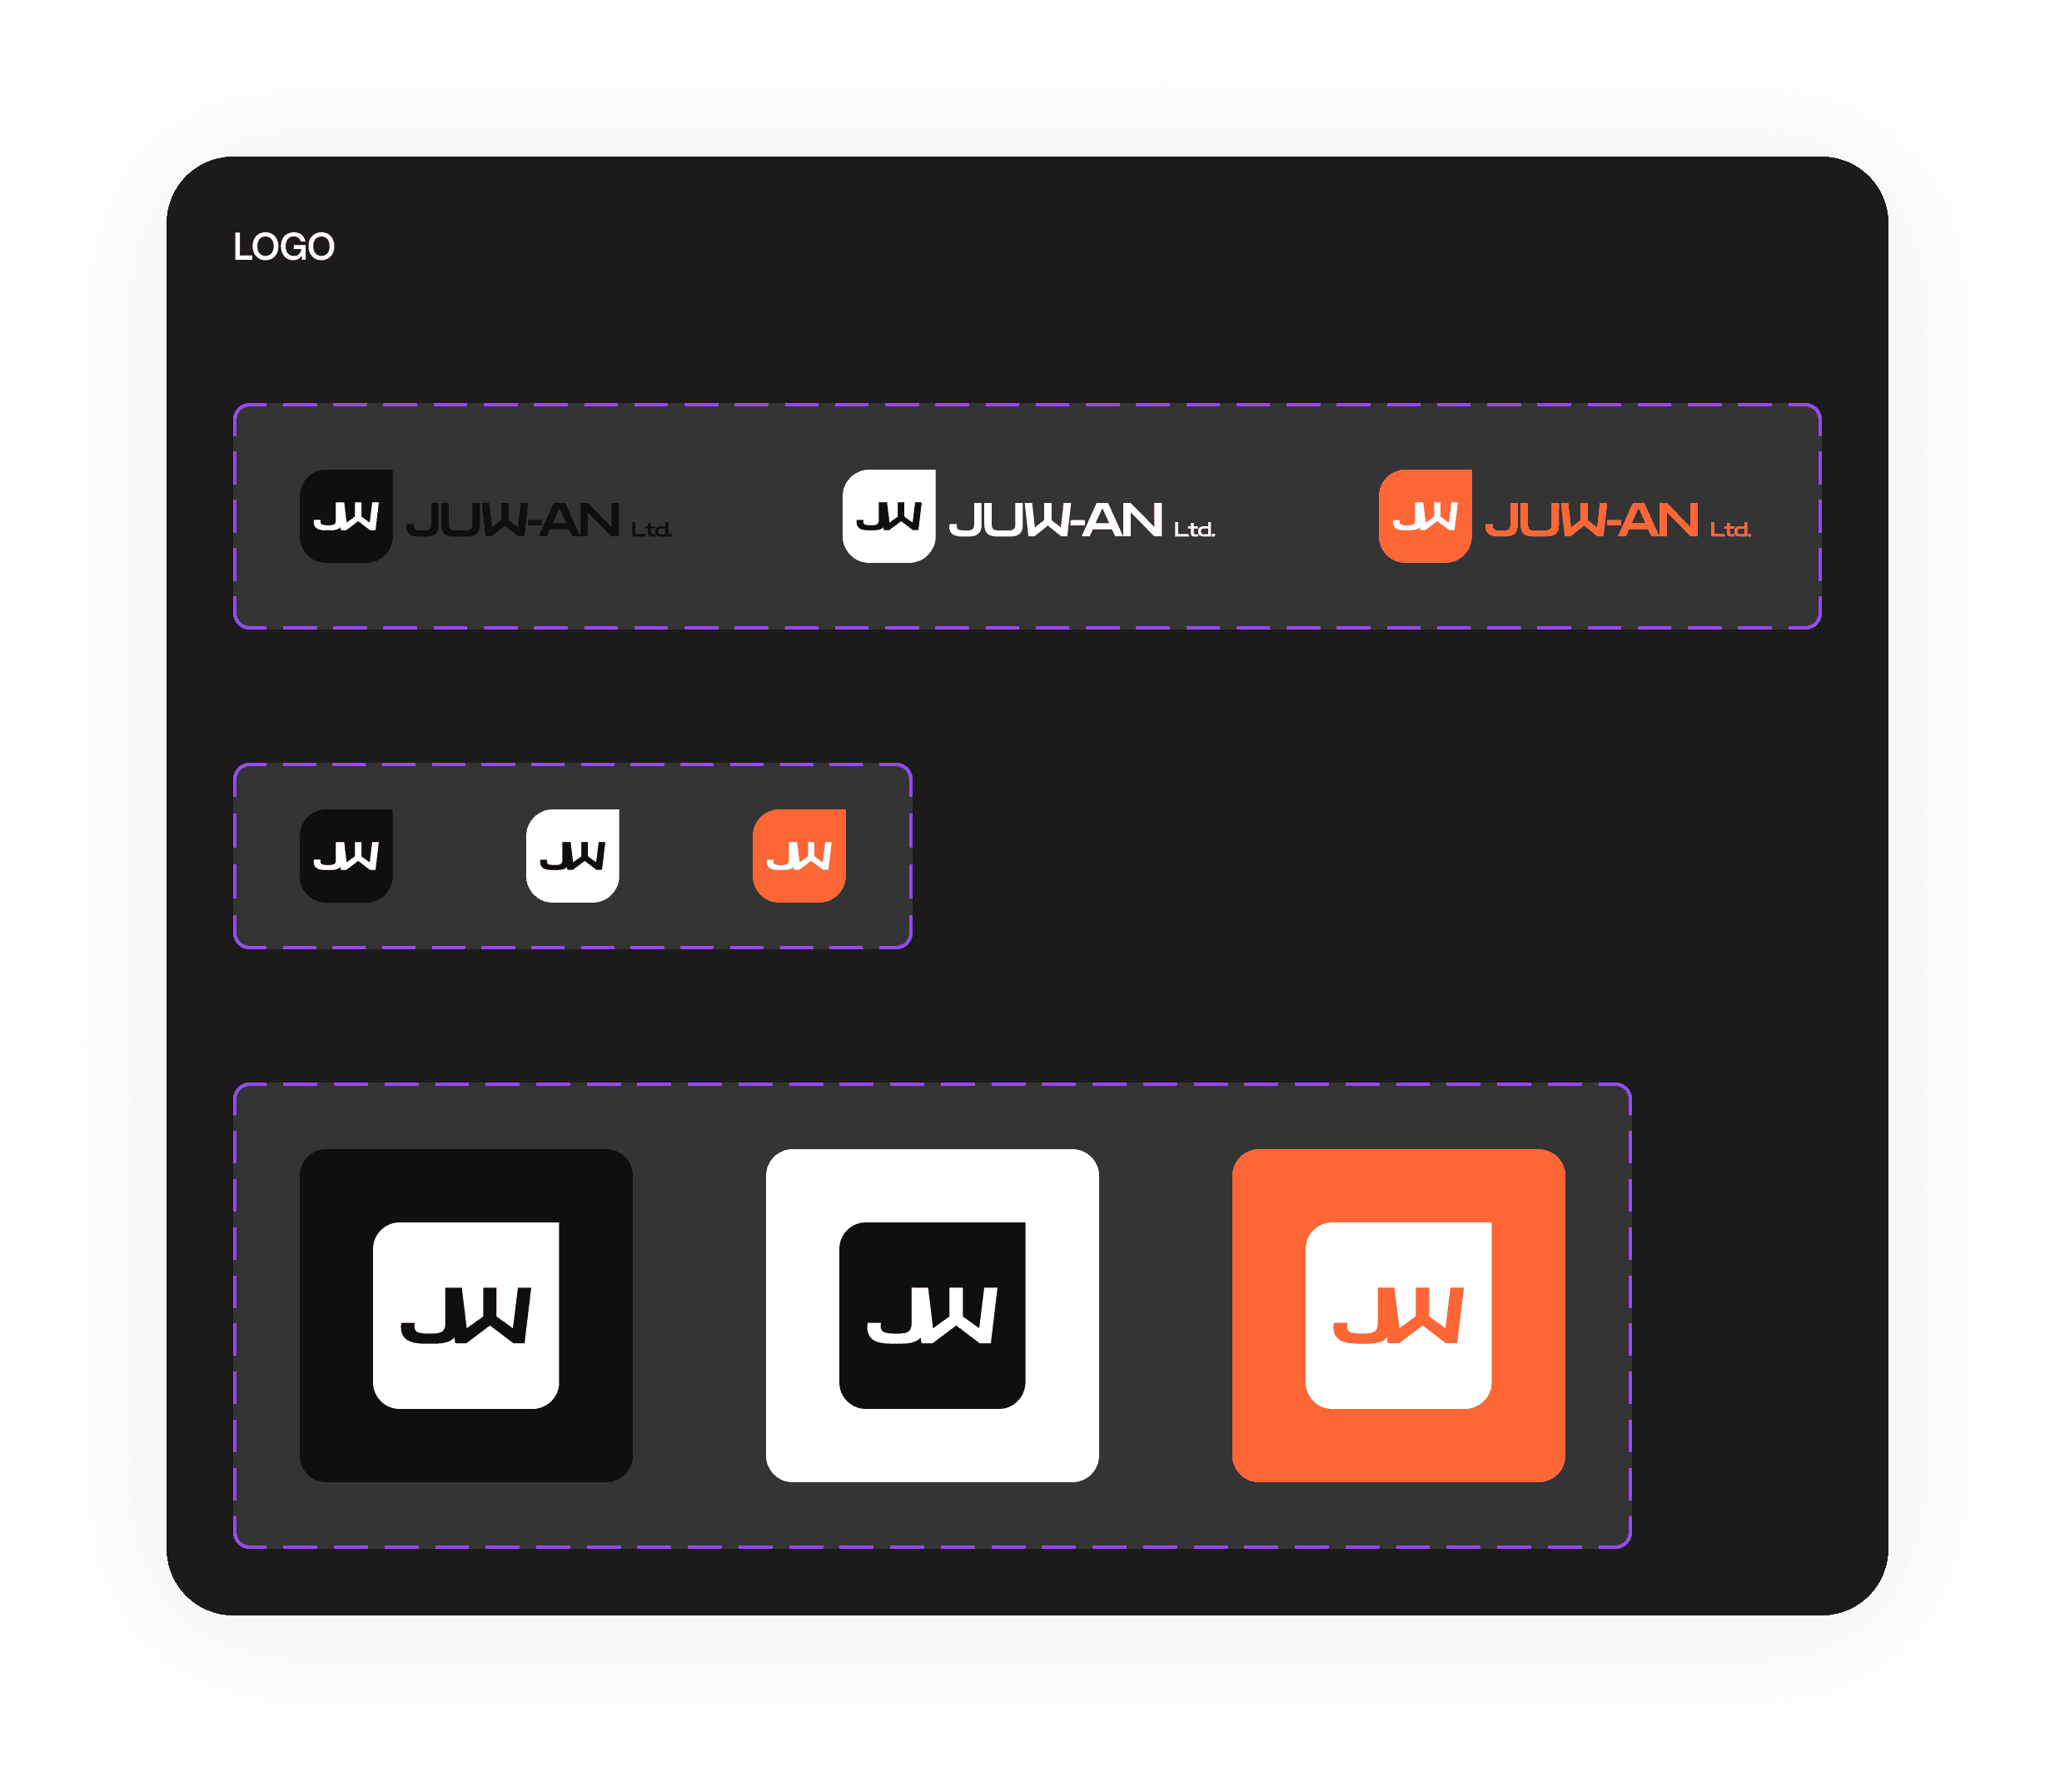
Color Palette Creation: I developed a strategic color palette based on psychology and industry standards:
Primary Background (#111033): Deep, sophisticated dark tone that conveys premium quality and focus
Primary Action (#FF6636): Vibrant orange for buttons and calls-to-action that creates energy and encourages interaction
Supporting Colors: Additional neutral tones to complement the primary palette
Typography System: Selected Tasa Orbiter Display as the primary typeface:
Tasa Orbiter Display: A distinctive, modern typeface that balances professionalism with approachability, providing excellent readability while maintaining a unique brand personality
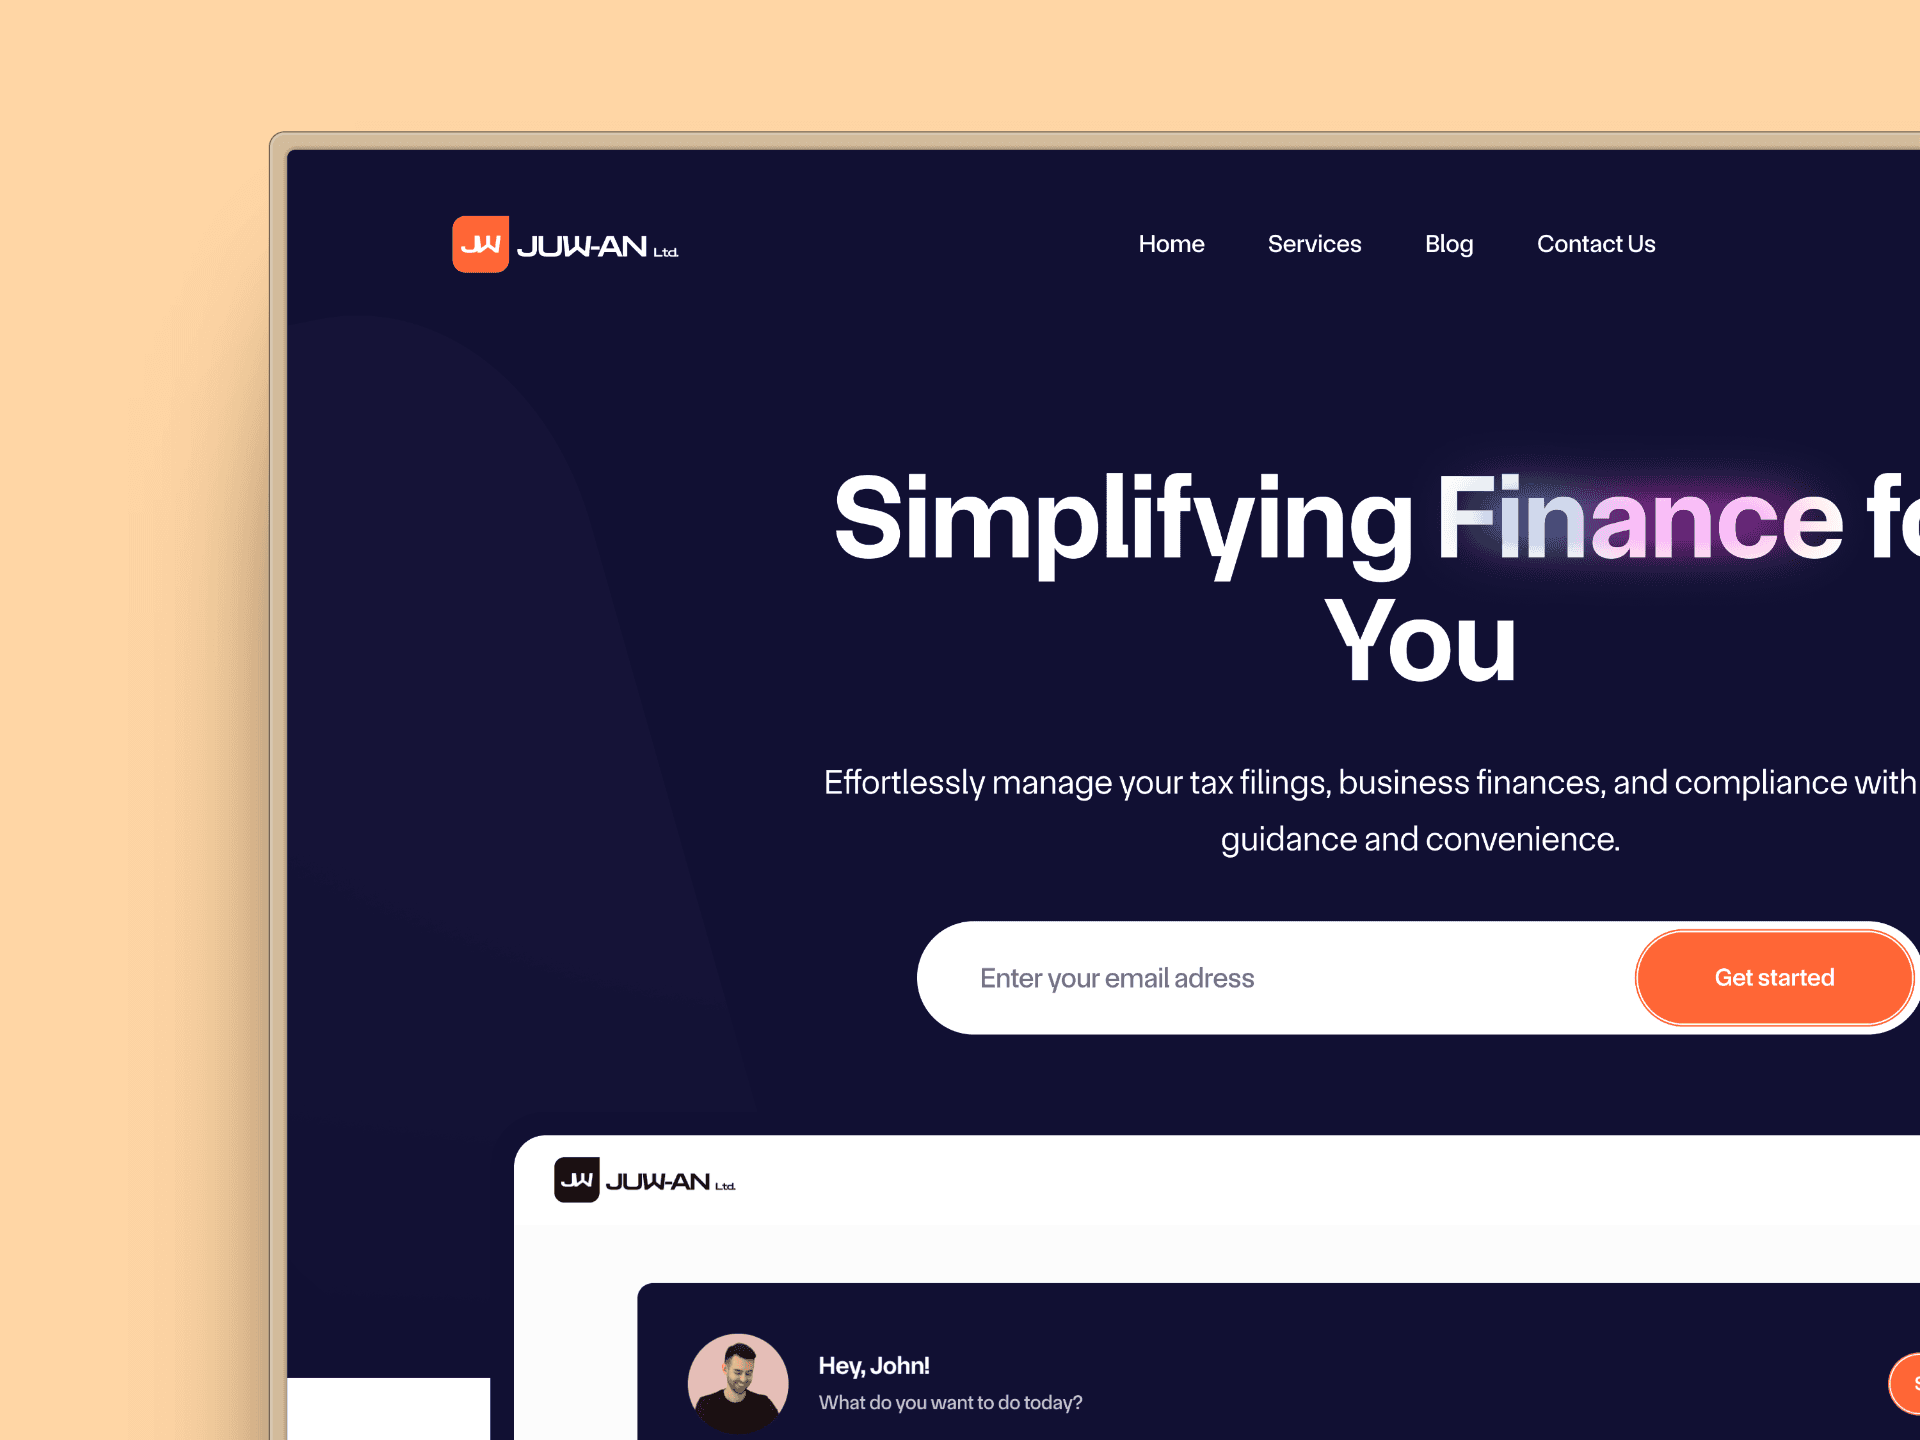
Visual Design Strategy: My approach focused on creating a premium, trustworthy appearance that would differentiate JU-WAN from competitors while remaining approachable for diverse client demographics.
Design System Development: I built a comprehensive design system with 47 reusable components:
Buttons: 8 variants for different contexts and hierarchies
Forms: 15 input types with validation states
Navigation: 4 navigation patterns for different user contexts
Data Display: 12 components for presenting complex financial information
Feedback: 6 notification and alert patterns
Platform-Specific Design Approaches
Landing Page Design
Client Web Application
Admin Dashboard
Design Validation & Iteration
Prototype Testing: I created high-fidelity prototypes for each platform and conducted usability testing:
Landing Page: 15 users tested conversion flows
Client Portal: 20 existing clients tested core workflows
Admin Dashboard: 5 staff members tested daily operations
Key Iterations Based on Testing:
Simplified Registration: Reduced form fields from 12 to 6 after testing showed 40% dropoff
Enhanced Progress Tracking: Added estimated completion dates after users expressed anxiety about timelines
Improved Mobile Navigation: Redesigned hamburger menu after users couldn't find key features
Admin Workflow Optimization: Consolidated task management after staff reported confusion
Design Impact & Results
User Interface Performance
Landing Page Conversion:
Bounce rate decreased from 78% to 34% after implementing progressive disclosure design
Contact form completion improved by 156% with simplified form design
Time on page increased by 89% through engaging visual storytelling
Client Portal Adoption:
95% of clients actively use the portal within first week of launch
Document upload completion rate: 97% with drag-and-drop interface
Support ticket reduction by 67% due to clear progress visualization
Mobile usage accounts for 43% of total portal interactions
Admin Dashboard Efficiency:
Task completion time reduced by 43% through workflow optimization
User error rates decreased by 78% with improved information hierarchy
Staff onboarding time cut from 2 weeks to 3 days with intuitive interface design
Design Validation Metrics
User Satisfaction Scores:
Landing page user experience: 4.6/5
Client portal usability: 4.7/5
Admin dashboard efficiency: 4.5/5
Accessibility Compliance:
WCAG 2.1 AA standards met across all platforms
Screen reader compatibility tested and verified
Keyboard navigation fully functional
Color contrast ratios exceed requirements
Design Tools & Methodology
Design Tools Used:
Figma: Primary design and prototyping tool
Optimal Workshop: Information architecture testing
Hotjar: User behavior analysis and heatmapping
Design Process:
Research Phase: User interviews, competitive analysis, stakeholder workshops
Information Architecture: Site mapping, user flow creation, content strategy
Wireframing: Low-fidelity layouts focusing on functionality
Visual Design: High-fidelity mockups with brand application
Prototyping: Interactive prototypes for user testing
Testing & Iteration: Usability testing with real users and stakeholders
Design System: Component library and style guide creation
Handoff: Detailed specifications and developer collaboration
Key Design Decisions
Immediate Feedback: All user actions receive instant visual confirmation
Progressive Disclosure: Complex information revealed gradually to avoid overwhelm
Consistent Patterns: Similar interactions behave identically across all platforms
Error Prevention: Form validation and helpful guidance prevent user mistakes
Conclusion
The project's success demonstrates the impact of thoughtful UI design on business outcomes. By focusing on user research, iterative design, and careful attention to trust-building elements, the design contributed significantly to improved client satisfaction, operational efficiency, and business growth.
The experience reinforced the importance of designing for emotional as well as functional needs, particularly in sensitive domains like financial services where trust and transparency are paramount.

